
Introducing the Trade Policy Dashboard
How To Know if Trump's Tariff Strategy is Actually Working

“I’ve been saying this for 35, 40 years: I’ve watched this country get ripped off by other nations, and I say ‘friend and foe.’ And believe me, the friends are in many cases worse than the foe. Look, we lost trillions of dollars last year on trade with this guy [Biden], trillions of dollars. And every year, we lose trillions. Trillions, right? Hundreds of billions, but basically trillions; we went over the ledge into the T word. And I can’t imagine it’s sustainable to have a country that can lose that much money for years into the future.” — President Donald Trump in The Atlantic
President Trump’s tariff agenda represents one of the most ambitious economic policy experiments in U.S. history — aimed not only at reshaping global trade but fundamentally redefining American economic strength. The “Liberation Day” rollout was hailed by supporters as the end of a failed era of trade liberalization and a necessary corrective to the failures of globalization for American workers and families. The tariffs have also provoked a wave of concerns from domestic stakeholders, turmoil in financial markets, and retaliation abroad.


But how should we evaluate the president’s actions on his own terms? That’s the question we have been grappling with at EIG.
And in response we have developed a scorecard to assess whether the tariff policy — as a centerpiece of the Trump economic agenda — is working as promised over time. Rather than litigate the premise of the president’s actions, we instead endeavored to take seriously (and, where possible, literally) the case for tariffs laid out by the Trump administration itself.
Trump’s theory of the case
While the specifics of the administration’s trade agenda continue to evolve, the underlying thesis behind Liberation Day is rooted in a few key tenets of Trump’s economic worldview:
Globalist elites have used trade policy to enrich themselves at the expense of U.S. workers and domestic industrial strength.
Persistent U.S. trade deficits are irrefutable evidence that other countries are taking advantage of the United States.
Misguided trade policy is a key driver behind U.S. factory closures, the decline in manufacturing employment, and the atrophy of the American middle class.
The decline of manufacturing employment is not a natural result of becoming a mature, wealthy economy, but rather a tragic consequence of policy failures that must be reversed.
According to the Trump administration, “changing this alarming trajectory requires a trade policy that is strategically coordinated to achieve three things: an increase in the manufacturing sector’s share of gross domestic product; an increase in real median household income; and a decrease in the size of the trade in goods deficit.”
What the administration wants is a “production economy,” one that is less reliant on the financial sector or access to cheap goods from abroad. And President Trump believes universal tariffs alongside aggressive reciprocal tariffs are the necessary foundation for building such an economy.
How Trump defines success
“These tariffs are central to President Trump’s plan to reverse the economic damage left by President Biden and put America on a path to a new golden age.” — White House Fact Sheet
President Trump has framed his tariff strategy as a catalyst for restoring American industrial strength and ushering in a new era of economic growth and prosperity.
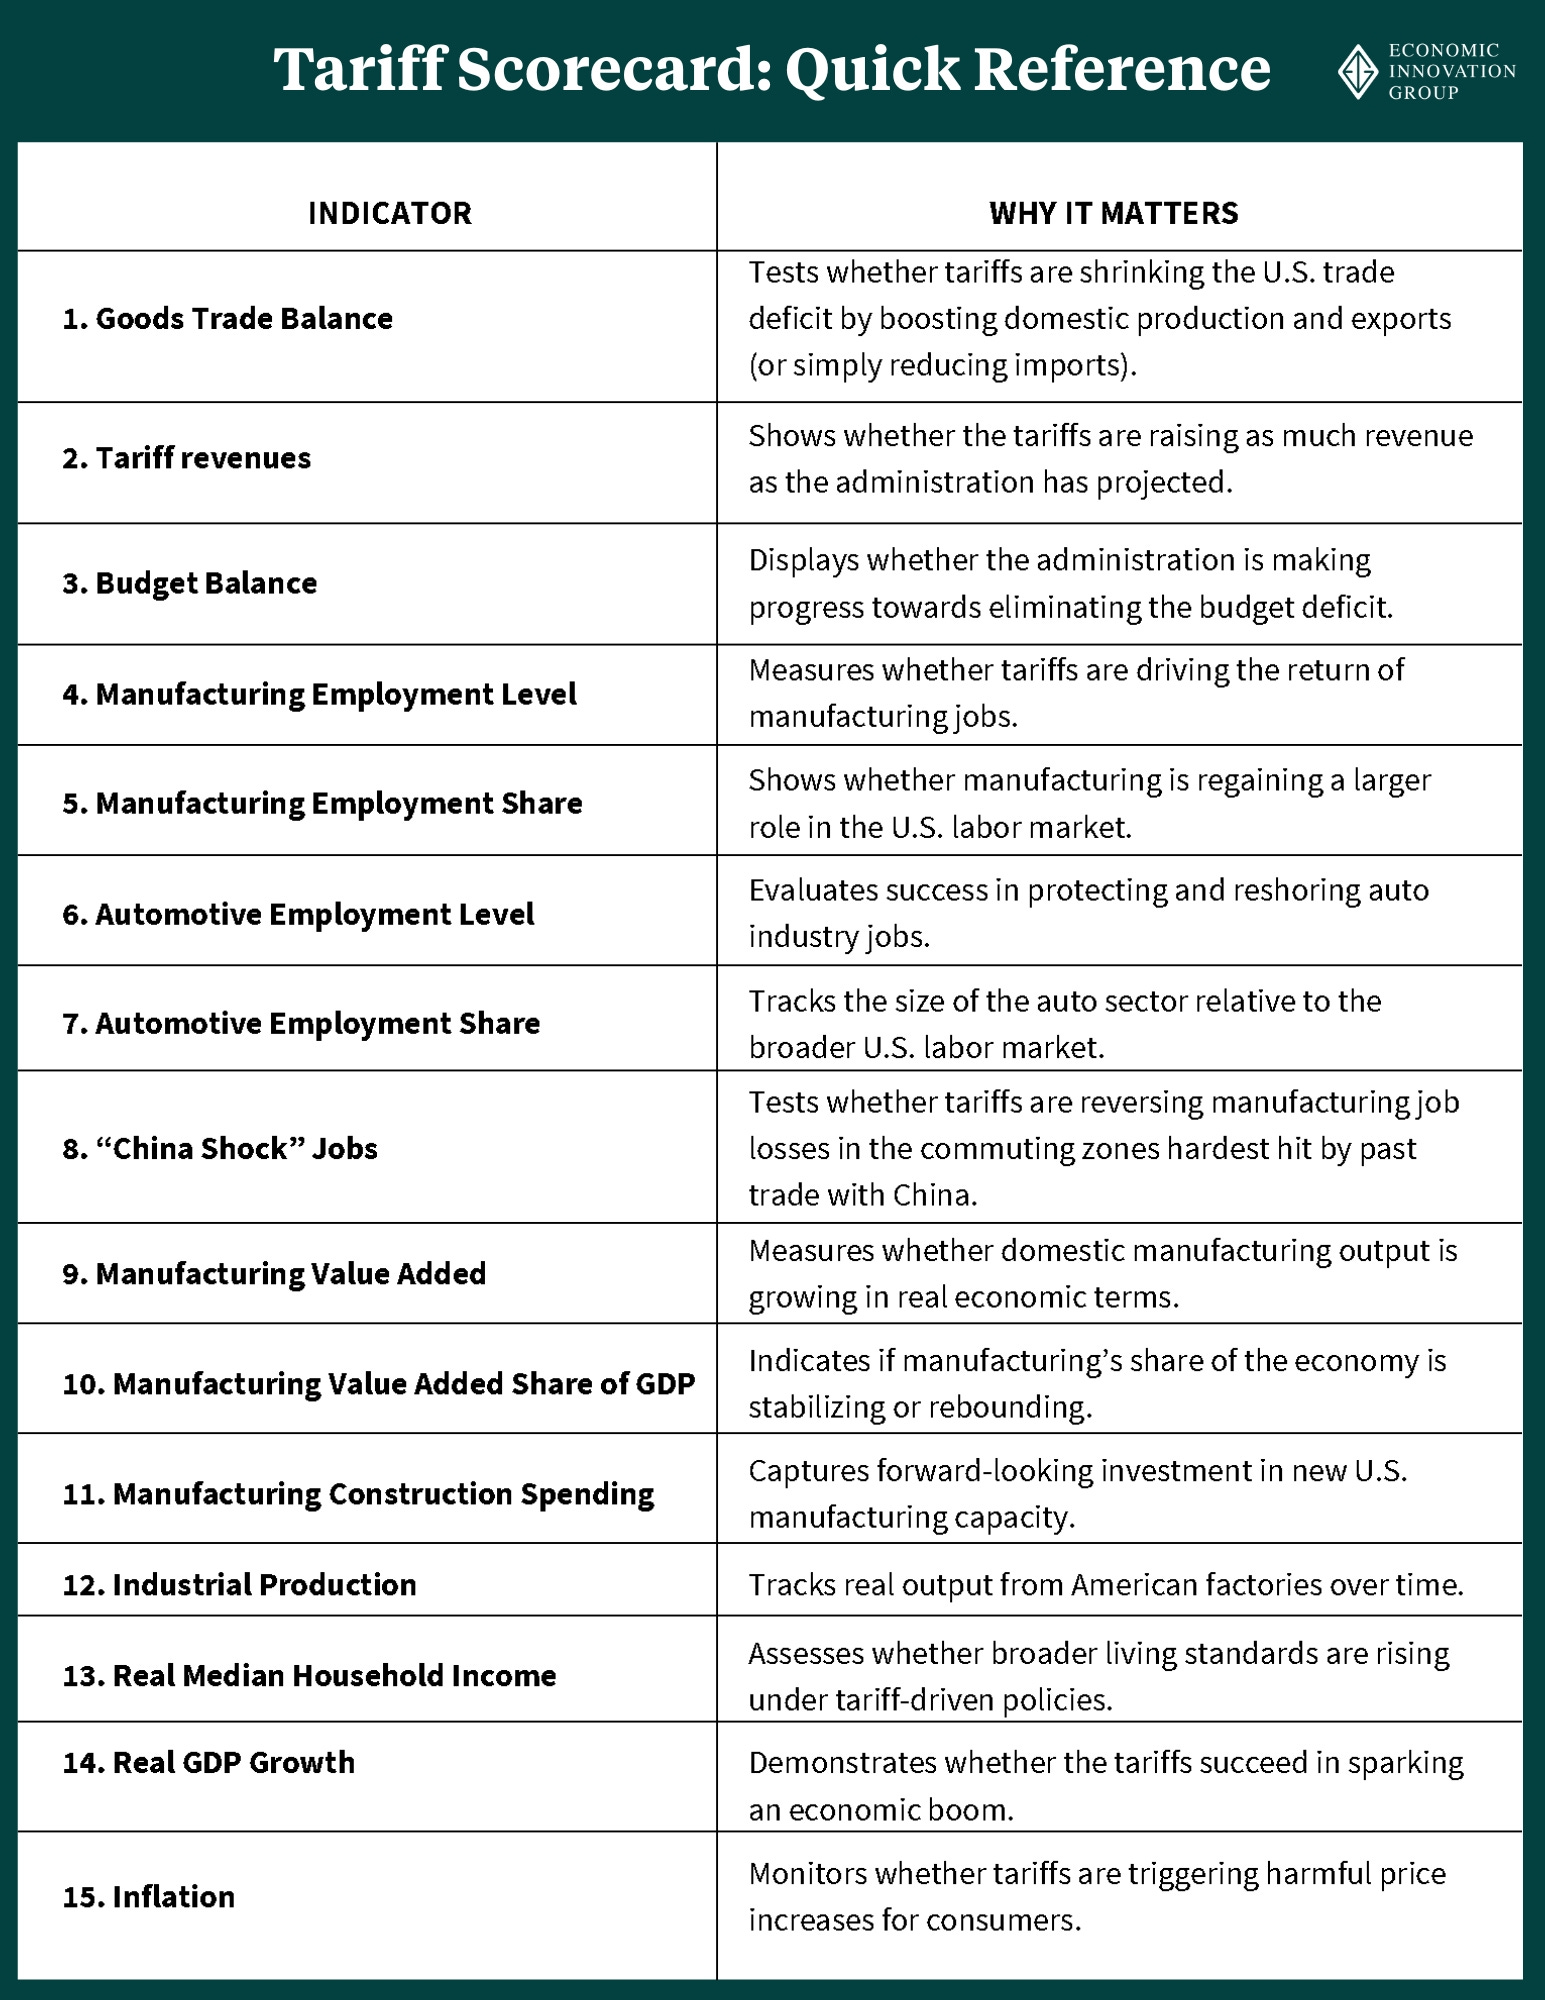
Using goals and metrics cited directly by the President and his top officials, we have identified a total of fifteen indicators to evaluate whether these promises are being fulfilled — covering the five key categories of trade flows, the federal budget, manufacturing employment, manufacturing output, and macroeconomic effects.
Together, these measures offer a comprehensive framework for assessing the impact of tariffs on the U.S. economy over time. While no single indicator can provide definitive proof that the administration’s agenda is working — and external factors beyond tariffs will also play a part — meaningful improvements across these measures would suggest that Trump is succeeding in reshaping the economic landscape as he promised he would.
To track these key indicators over time, we are pleased to present EIG’s new interactive Trade Policy Dashboard. Click the image below to explore the dashboard and see how the data is trending. Also below is our guide to the specific indicators it includes and why we chose each of them.

For some of the indicators, we have set precise targets that define success if the Trump administration is able to meet them. These are indicators where administration officials have themselves provided a specific target or made public comments from which a target might reasonably be inferred. We have cited those comments where applicable. For other indicators, success will be defined either by a sharp break in a historical trend that the White House aims to reverse or by a sustained, marked improvement that can be attributed to the tariff policy.
Let’s look at each indicator, grouped by category, more closely.
TRADE FLOWS
1. Goods Trade Balance
There is no more important or oft-cited indicator for President Trump than the goods trade balance, which measures the difference between the value of goods the U.S. exports and the goods it imports. Trump believes that bilateral trade deficits are equivalent to a direct subsidy paid by the United States to foreign countries. Consider, for example, how he described the U.S. trade relationship with Canada, one of our largest trading partners: “[W]e’re spending $200 billion a year to subsidize Canada … We do it because we want to be helpful, but it comes a point when you just can’t do that.”
The Trump administration has claimed that “reversing the flow of American wealth to foreign countries in the form of the trade deficit” would allow the U.S. to reclaim its technological, economic, and military edge. This is the logic behind the original calculation of reciprocal tariffs, which the administration stated were set at levels intended to eliminate bilateral trade imbalances. The biggest of these imbalances was the bilateral goods trade deficit with China, which for 2024 was nearly $300 billion.
Last year the U.S. also recorded an overall goods trade deficit of about $1.2 trillion, the largest on record.1 The administration has made it clear that bringing this deficit to zero is a central priority.
BUDGETARY IMPACTS
2. Tariff Revenue
The Trump administration has repeatedly argued that tariffs will be a significant source of revenue. Trade advisor Peter Navarro, for example, asserted just prior to Liberation Day that they would raise $600 billion per year. We therefore believe that this figure is a useful target for defining the success of the tariff policy in generating new money for the federal coffers.
In 2024, total revenue from customs duties (more than 90 percent of which came from tariffs) equaled $83 billion, or less than one-sixth the amount projected by Navarro.
3. Budget Balance
In addition to arguing that tariffs will be a significant source of revenue, President Trump has said that he will balance the federal budget for the first time in 24 years. Trump has not, in fairness, cited tariff revenues as the only or primary contributor in his plan to achieve a balanced budget. But as trade policy is such an integral part of his overall economic agenda — and given that he has also speculated that tariff revenues might be large enough to offset income tax cuts for many Americans — we believe deficit reduction is an important factor in assessing the overall impact of the trade agenda.
MANUFACTURING EMPLOYMENT
4. Manufacturing Employment Level
The manufacturing employment level tracks the total number of Americans working in industries such as machinery, automobiles, electronics, and consumer goods. “Using trade policy to increase the number of manufacturing jobs in our country… will help raise wages and return our country to one with a more vibrant and secure middle class,” according to the administration’s 2025 Trade Policy Agenda.
As of early 2025, manufacturing employment stood at just under 13 million, well below the roughly 17 million jobs present in the year 2000, right before China’s entry into the World Trade Organization (WTO), which the administration has repeatedly blamed for lower incomes and lost jobs.
5. Manufacturing Employment Share
In his second inaugural address, President Trump boldly declared that “America will be a manufacturing nation once again.” Accomplishing this requires more than just increasing the absolute number of manufacturing workers, but also boosting the share of the total U.S. workforce employed in the manufacturing sector. In 1970, 31 percent of all private sector jobs were in manufacturing; by 2024, that share had fallen to just over nine percent. Reversing this decline has been a central aspiration of tariff advocates.
6. Automotive Employment Level
The automotive sector has long been a particular focus of President Trump and his trade agenda, which seeks “better-paying American jobs making beautiful American-made cars.” One of the key justifications given for deploying aggressive tariffs is to counter the “variety of non-tariff barriers that impede access to the Japanese and Korean automotive markets.”
The automotive employment level captures the number of workers directly employed in motor vehicle manufacturing and parts production. As of early 2025, automotive manufacturing employed about one million workers. Raising the sector’s employment to the level from just before China’s entry into the WTO would require a 30 percent increase, for a total of 1.3 million jobs.
7. Automotive Employment Share
Automotive employment share measures the proportion of the auto sector’s employment relative to the broader labor market. At the turn of the 21st century, the auto sector accounted for 1.2 percent of all private sector jobs. Today, its share stands at 0.7 percent. A rising share would suggest that domestic auto production is gaining strength under the new trade policies. A declining share would indicate that tariffs might instead be harming the sector, or that the sector’s growth is failing to keep pace with other parts of the labor market.
8. Manufacturing Employment in “China Shock” Places
A central goal of Trump’s tariff agenda is reversing the harms to U.S. workers and communities caused by China. The economists David Autor, David Dorn, and Gordon Hanson identified the 145 commuting zones in the United States that were most impacted by trade with China. These areas, particularly in the Midwest and South, experienced some of the worst deindustrialization of the past generation. Manufacturing employment in these commuting zones was 2.2 million jobs as of 2022, the most recent available data, compared to 3.2 million jobs just before China joined the WTO in 2001.
A significant manufacturing rebound in these communities would be strong evidence that tariffs are reversing regional economic decline and breaking from the recent pattern of manufacturing jobs growth concentrating in the Sun Belt and Mountain West regions.
MANUFACTURING OUTPUT
9. Manufacturing Value Added
Manufacturing value added measures the total output of the U.S. manufacturing sector, subtracting intermediate inputs, and reflects the true economic contribution of domestic manufacturing. In 2024, manufacturing value added accounted for a record $2.4 trillion.2 But the Trump administration argues that the “decline in manufacturing output has reduced U.S. manufacturing capacity.” The White House also says that goods trade deficits have led to the “hollowing out” of the manufacturing base and “resulted in a lack of incentive to increase advanced domestic manufacturing capacity.”
Success on this metric would require at least maintaining — if not significantly improving — the sector’s long-term growth rate heading into the Trump administration.
10. Manufacturing Value Added Share of GDP
This indicator tracks the share of overall U.S. economic output generated by the manufacturing sector. The Trump administration has included “an increase in the manufacturing sector’s share of gross domestic product” as one of the specific goals of its trade agenda.
Manufacturing’s share of GDP has been on a long-running downward trend, falling from around 24 percent in 1970 to just under 10 percent in 2024. A sustained rising share would be strong evidence that the administration’s trade policies are succeeding in elevating the role of manufacturing within the U.S. economy. For reference, it would require a roughly 50 percent increase simply to bring manufacturing’s share of GDP back to where it stood at the turn of the 21st century.
11. Manufacturing Construction Spending
Manufacturing construction spending measures investment in new and expanded factory facilities. President Trump inherited a boom in such investment thanks to massive growth in 2023–2024, when manufacturing construction surged to historic highs, largely driven by semiconductor, electric vehicle, and energy-related investments. Such spending rose from about $18 billion3 in the fourth quarter of 2019 (the last quarter before the pandemic) to roughly $38 billion in the fourth quarter of last year (the last full quarter of the Biden administration). But Trump has promised to do even better: “Jobs and factories will come roaring back into our country.”
We believe that simply sustaining the level of construction spending that Trump inherited would be a significant achievement and a major vote of confidence from industry for the president’s agenda.
12. Industrial Production
Industrial production measures the total output of U.S. factories, mines, and utilities. Compared to 2000 levels, manufacturing output is only modestly higher — and still below its pre-Great Recession peak. In declaring that foreign trade and economic practices have created a national emergency, President Trump pointed to the decline in manufacturing output as one of the key justifications for ramping up tariffs.
A sustained increase in industrial production would suggest that tariffs and related policies are helping to return the U.S. to the kind of growth that was typical prior to the Great Recession.
MACROECONOMIC EFFECTS
13. Real Median Household Income
Real median household income (MHI) measures the inflation-adjusted earnings of a typical U.S. household. An increase in real MHI is one of the most prominent metrics set by the Trump Administration for measuring the success of its trade agenda after years of tepid post-pandemic growth.
The administration celebrated the 3.4 percent annual growth rate of real MHI from 2016 to 2019 during President Trump’s first term prior to the pandemic. Therefore we believe this same growth rate provides a reasonable baseline for success going forward.
14. Real GDP Growth
The Trump administration has promised that its agenda will usher in a new Golden Age of economic growth, with tariffs playing a leading role alongside tax cuts and deregulation. Stephen Miran, chair of President Trump's Council of Economic Advisors, has argued that the tax relief made possible by the tariffs “will create economic growth.” As tariff revenues can also be used to reduce the deficit, Miran adds that the resulting lower interest rates will stimulate “an economic boom.” The White House also has cited an external study finding that “a global tariff of 10% would grow the economy by $728 billion.” We believe that 3 percent real GDP growth, sustained over time, is a reasonable target for a new Golden Age. (The American economy previously hit that target in multiple quarters both during President Trump’s first term and under the Biden administration.)4
15. Inflation
Inflation measures the rate at which prices for goods and services in an economy rise over time. The spike in inflation to multi-decade highs during the Biden administration was a key reason for widespread dissatisfaction with the economy. Trump promised to “end inflation and make America affordable again” in his campaign platform.
Tariffs tend to raise the price of imported goods, but they are best thought of as a one-time increase in the price level — a kind of sales tax — rather than inflationary in the technical sense. An ongoing escalation of tariffs and retaliatory measures, however, could become an engine for sustained inflation, rather than a one-off price increase.
Heading into the Trump presidency, inflation was running at roughly 2.5 percent year-over-year, above the Federal Reserve’s target of 2 percent.
Conclusion
President Trump has promoted tariffs as a transformational tool for American industry, workers, and communities. His trade agenda is more than an attempt to simply accelerate economic growth and prosperity — it is also an effort to reverse long-running, structural trends in U.S. employment, industry composition, and global connectedness.
In the years ahead, the Trade Policy Dashboard will reveal whether or not he succeeded.
——————————————
Special thanks to EIG researchers Sarah Eckhardt and Jiaxin He for their painstaking work in constructing the dashboard, and to chief economist Adam Ozimek and research director Nathan Goldschlag for their advice about the economic indicators included on it.
Both the bilateral goods trade deficit with China and the overall U.S. goods trade deficit are given here in nominal U.S. dollars.
Inflation-adjusted using 2017 dollars, as per the Bureau of Economic Analysis
Seasonally adjusted using the X-13 seasonal adjustment from the Census Bureau, in 2017 dollars (adjusted using Price Index for Private Fixed Investment in Manufacturing Structures to be consistent with the Federal Reserve and the BEA). Available beginning Q1 1993.
The specific metric we are using is the growth rate of each quarter’s real GDP over the same quarter the prior year.