The Year in Business Dynamism
There was no way to know, during the peak pandemic days of 2020, whether the observed spike in entrepreneurial activity that year was a real trend.
Was it a statistical anomaly? Or perhaps it was a temporary event caused by a unique set of pressures, workers reassessing their lives and career paths and trying something new, the trend likely to fade along with the pandemic itself.
More than four years later, though, entrepreneurial activity is still elevated.1 A combination of economic indicators from this year confirms that the rates of people starting new businesses remain higher than in the pre-pandemic days — and so do rates of business deaths, a crucial but underappreciated marker of economic dynamism. It is unclear what exactly is behind this higher level of entrepreneurialism or how long it will last. But, should it continue, then it bodes well for new jobs, technological inventions, and overall economic growth.
These indicators come from different data sets and aren’t always easy to understand or reconcile. So in this post, we look at each in turn and explain their relevance — and what each tells us about the present and future of the American economy.2
1) Applications for new businesses in 2024 continue to exceed pre-pandemic highs — by a lot.
When a budding entrepreneur wants to start a new business, they have to apply for an Employer Identification Number, or EIN, from the government.3 Not every startup that applies for one eventually becomes an actual operating business. But the total number of these applications each month is nonetheless a useful proxy for planned entrepreneurial activity.
Furthermore, not every startup that applies for an Employer Identification Number expects to hire employees; some new businesses are more akin to a freelancing outfit of just one or two people (think of a custom jewelry maker who sets up a shop on Etsy). So the Census Bureau tracks a sub-category of “high propensity applications” — for those businesses that do plan to expand and hire employees. High propensity applications thus provide the most current and useful information about shifts in entrepreneurial activity.
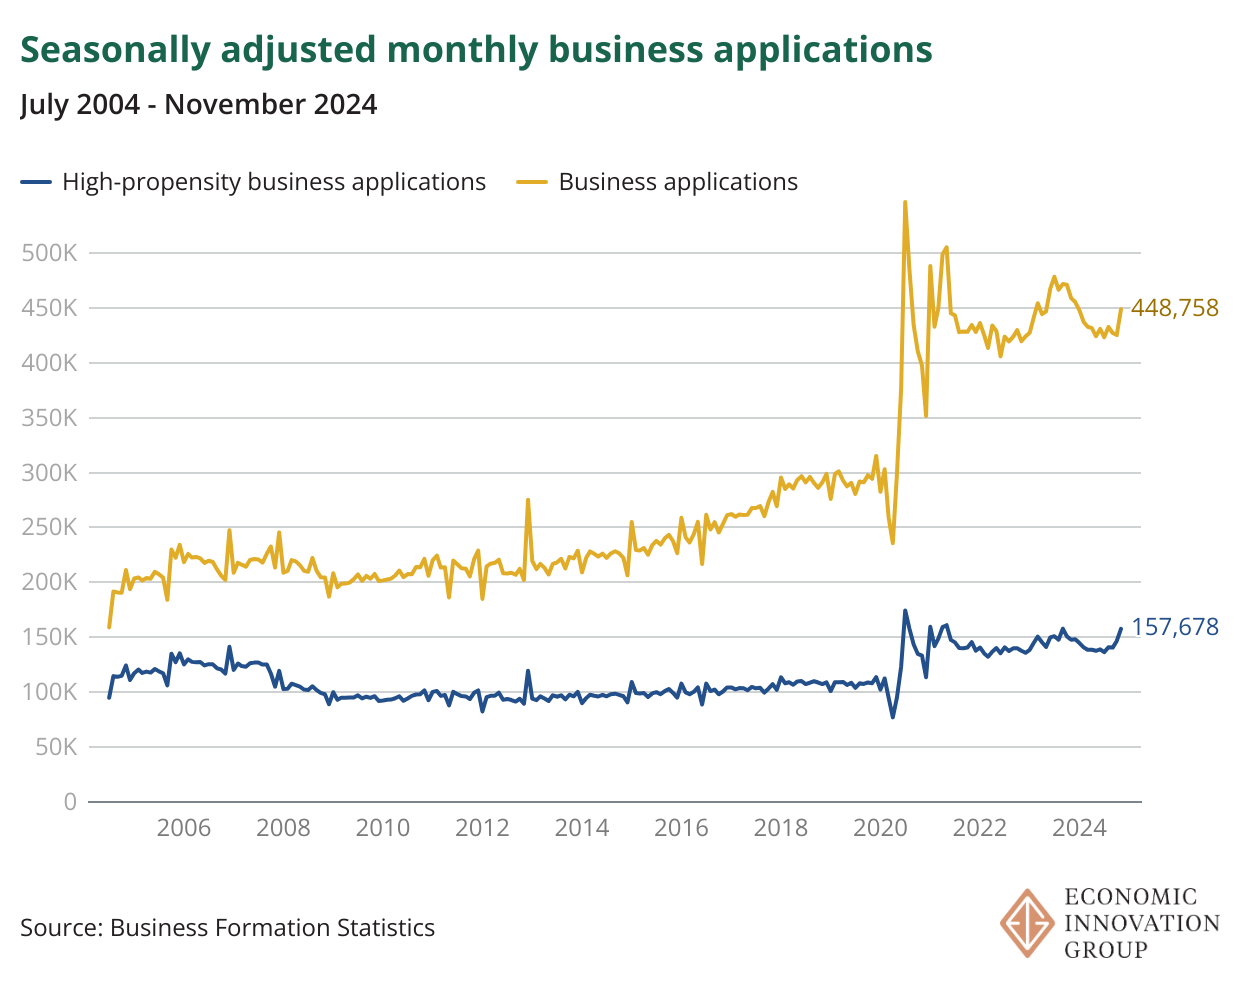
Before the pandemic, startup founders were filing an average of roughly 100,000 high propensity applications each month. This year, through November, the average monthly number was more than 40 percent higher, at roughly 142,000. Although the monthly levels of both high propensity and overall business applications are slightly down from last year (-3.95 percent and -5.31 percent respectively), they have been stable at the higher post-pandemic levels for more than four years now. You see the trend clearly in this chart:
2) The startup boom is broadbased, applying to most industries across the economy.
Through November, only six out of 20 industries had lower monthly rates of high-propensity applications in 2024 than they had in 2019, the year before the pandemic. And even those lagging industries — which include mining and agriculture — tended to be ones that have been declining as a share of national economic output.
The other 14 industries, representing 70 percent of industries throughout the economy, enjoyed higher rates of startup activity.
Standouts include retail trade, which have averaged 19,300 monthly high-propensity applications this year, compared to just 11,900 in 2019 — 1.6 times higher.4
The Healthcare & Social Assistance industry has enjoyed a 1.5 fold increase, while the gains for Accommodation & Food Services (1.55 times higher) and Construction (1.27 times higher) also impressed.
Together, these four industries — Retail Trade, Healthcare & Social Assistance, Accommodation & Food Services, and Construction — account for 60 percent of all high-propensity applications, further demonstrating the widespread nature of the startup boom.
3) The startup boom is geographically broadbased as well.
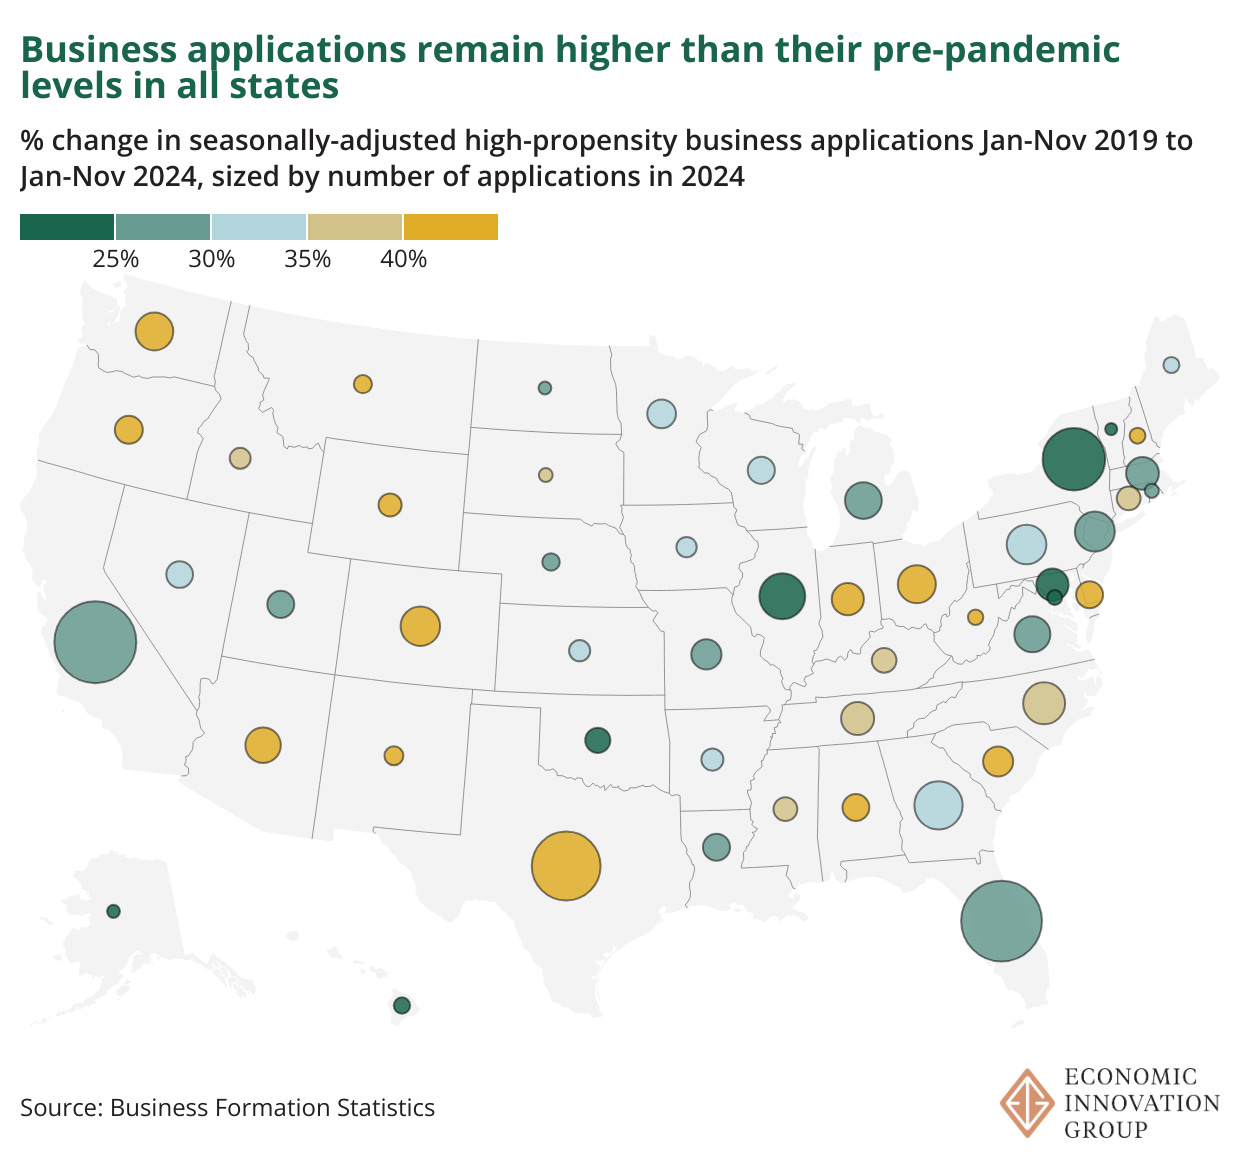
Since last year, the number of high-propensity applications has modestly declined in most states, reflecting the nationwide trend. But without a single exception, every state in the country is now more entrepreneurial than it was five years ago.
Florida, California, and Texas – the three most populous states – are the leaders, with the three fastest growth rates of high-propensity applications when comparing 2019 to 2024 (year-to-date, with December excluded in both years). But all states have shown positive growth:
4) The surge in applications is leading to a surge in businesses opening.
An application to start a business is one thing. But does it actually result in a new business?
According to the Census Bureau, there has historically been a relatively constant relationship between applications and eventual businesses opening. Roughly a quarter to a third of high-propensity applicants begin paying wages within a year of the initial EIN filing.5 But as this estimate was last updated in 2020, and given the unusual economic circumstances since then, it is at least conceivable that new businesses may now be failing in their early stages, potentially erasing the gains suggested by the application surge.
To find out, we can turn to the quarterly estimates of new establishment births and deaths from the Bureau of Labor Statistics, which reveal that new establishment openings are rising with business applications, with a lag of approximately one year.6 (Establishments refer to physical locations where businesses conduct operations. A single business may have multiple establishments.)
In the first quarter of this year (the most recent quarter for which data is available), 322,000 new establishments were opened — 1.45 times higher than the pre-pandemic average 221,900 per quarter.7
This translates to a significant leap in cumulative establishment births. If the slower, pre-pandemic pace had continued, there would have been more than a million fewer new establishments opened in the three-year period through the first quarter of 2024.
Furthermore, the positive relationship between business applications and establishment openings can be observed for individual states as well — though the link is stronger in some states than in others, and a few states (like Delaware and Wyoming) are significant outliers.
But as with applications, every single state had more establishment births in the most recent year of available data than in 2019.
5) More businesses are dying too.
Importantly, the BLS data also shows that establishment deaths are rising, leaving the economy in a place of higher churn. Roughly 293,000 establishments died in the third quarter of last year (the most recent data available), 22 percent more than in the first quarter of 2020, when 240,000 died.8 (And, again, establishments are not the same as businesses, as one business can have multiple establishments — but nonetheless the trends affecting establishments are useful proxies for what’s happening to businesses generally, the best we have.)
The combination of more startups and more deaths is a healthy signal of economic dynamism in the American economy. More churn means more competition, as new entrants with new ideas displace incumbents. It means more risk-taking with new technologies and ideas. Some of these ideas and technologies inevitably fail. But those that survive represent genuine innovations and lead to greater variety in the kinds of places where people can work and the products that consumers can buy. It represents the process by which real wages grow, new technologies are discovered, and living standards rise.
It is too early to know the magnitude of the effect generated by this increase in dynamism — but the increase itself is substantial and has continued in 2024.
This post has a GitHub repository, see (https://github.com/EIG-Research/dynamism2024).
A detailed discussion of these trends, released last year, can be found in "Surging Business Formation in the Pandemic: Causes and Consequences?" by Ryan Decker and John Haltiwanger (link)
Sole proprietorships without employees are not required to apply for an EIN. Independent contractors may do so, but it is not required.
Retail trade had a record breaking 33,900 new high-propensity applications in November 2024. As of now, we do not know the cause of the spike, or whether it is indicative of a new volatile trend.
https://www.census.gov/econ/bfs/current/index.html
The Census’ Business Formation Statistics tracks applications for establishments as well as other tax filing business entities, while the Bureau of Labor Statistics’ Businesses and Employment Dynamics tracks establishments.
Measured over the period of 1994-2007 and 2012-2019, to eliminate recessionary impacts.
We use the first quarter of 2020 as a comparison because business births and deaths lag behind economic shocks. Business deaths did not spike until Quarter 2 of 2020.


